Electroencephalography (EEG) is quickly becoming part of many business-as-usual processes (BAU) and has some importance in the research and design (R & D) programmes of leading technology corporations. It’s growing popularity in industry is owing to a wave of accessible low-cost, consumer-grade data-acquisition packages. However, the uptake of EEG into BAU processes is often coupled with poor understanding of the technology. As industrial applications of any technology rest upon fundamental scientific principles, it’s important these principles are well understood in theory and application. This article touches on some of the fundamental physiological and engineering principles that EEG technology is built upon, and forms part of a larger series that delves into EEG research and development from a hands-on perspective.

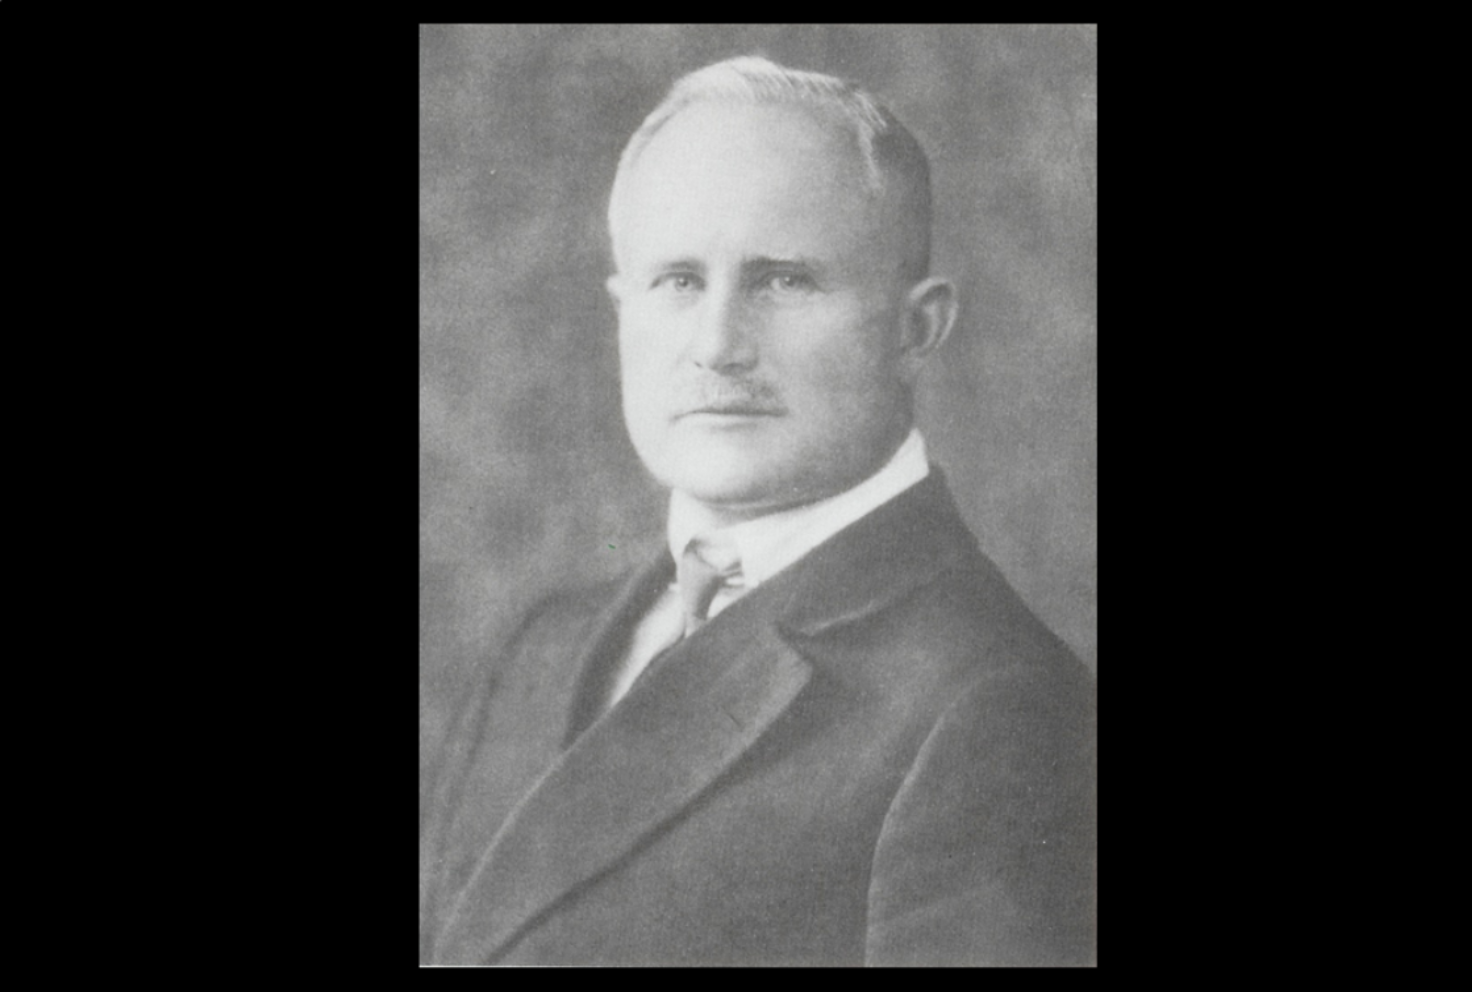
Dr Hans Berger the pioneer of human electroencephalography and the author of the first papers documenting human alpha rhythms in experimental participants (see Berger, 1929).
The electroencephalogram (EEG)
An electroencephalographic signal is represented as a voltage measurement changing over time. Characteristically, multiple electrodes will be placed across the head according to a standardised electrode positioning system known as the 10-20 system (or variant thereof: 10-10, 10-5 etc.) and measurements at each electrode are made concurrently across the head—a reference and ground electrode are also placed on the body of the participant. Generally, these measurements are digitised and stored for later off-line analysis—there are also real-time (on-line) methods for analysing EEG, which are not covered in this series of articles. The resultant record or measurement is known as an electroencephalogram (EEG).

The source of EEG activity
The biological current-sources that contribute to the electroencephalogram are predominantly located in the outer layers of the brain: the cerebral cortex, identified as the folded, furrowed, visible outer layers. Large pools of cortical neurons, typically pyramidal neurons, are thought to synchronise their firing patterns under different sensory, motoric, psychological and emotional demands (Lopes da Silva, 2013). The synchronised activity is enabled partly by electro-chemical connections between adjacent nerve cells and changing electrostatic environment outside the nerve cells (Amzica and Lopes da Silva, 2012; Wendling and Lopes da Silva, 2012). The synchronisation is also partly enabled by cortical-deep brain connections, where adjacent as well as distant regions of cortical tissue may synchronise the timing of the neuro-electrical activity, so as to serve a specific purpose in information-processing in the brain (Nunez, Srinivasan, Westdorp, Wijesinghe, et al., 1997; Pfurtscheller and Lopez da Sliva, 1999; Suffczynski, Kalitzin, Pfurtscheller, & Lopes da Silva, 2001).
The synchronised firing patterns can vary in frequency and region of the scalp depending on the demands placed on the experimental participant and the motoric, cognitive, and affective processes involved (Klimesch, 1999; Onton, Delorme and Makieg, 2005; Pfurtscheller and Neuper, 1994; Pfurtscheller, Stancak and Neuper, 1996). These neural firing patterns measured on the head are associated with different types of neuro-electrical potentials. Of prime importance to EEG are the electrical potentials generated across the post-synaptic/dendritic membrane, particularly those that are excitatory: those potentials that lead to local depolarisation of the nerve cell. These electrical potentials are longer in duration and summate more readily with neighbouring electrical fields, in comparison to the fast-spiking activity of the axonal action-potential (Amzica and Lopes da Silva, 2012). The interaction and summation of these potentials gives rise to cortical local field potentials (LFPs), i.e. patches (volumes) of cortical tissue wherein electrical dipolar sources exist for a period of time, corresponding to information-processing demands of a given task or environment. It’s these LFPs that conduct through the head and are measured by the electrodes placed on the head (Lopes da Silva, 2013).
Deep brain electrical activity and EEG
Not all the brain’s electrical activity is sensed by EEG, only cortical activity is thought to be measured, not deep-brain structures, such as the amygdala, hippocampus, and basal ganglia. The reason that cortical currents and not those deep within the brain are sensed by electrodes on the head is that current-sources within the deep-brain are, generally speaking, not strong enough to conduct through neural tissue, the membrane underneath the skull, and the skull itself to reach the measurement electrode sitting on the head. Neural electrical potentials are very low-voltage (microvolt scale) and the skull and meninges (membranous layers adjacent to the inner surface of the skull) have low conductivities and thus effect a large amount of attenuation on the electrical field strength (Nunez and Srinivasan, 2005; Wolters and Munck, 2007).
Cortical current sources interact with each other and can summate or cancel each other out through different types of electrical interference. Particularly in a structure like the brain, summation or cancellation are dependent on the orientation of the electrical field created by these underlying electrical potentials (see Lopes da Silva, 2013, p.1112-1113). The orientation of many deep-brain electrical sources, the volume of tissue through which they must conduct, as well as the potential interactions with other current sources, deep-brain and cortical, lead to many of these sources being cancelled before they can conduct to the tissue underneath the scalp.
Another point to take into consideration is that because the cortex folds over forming ridges (gyri) and furrows (sulci), a portion of the cortical electrical sources are oriented in such a way that even though they do not interact and cancel, due to their orientation relative to the surface of the head, their currents cannot be sensed: for example, certain electrical sources within the upper bank of the auditory cortex are often not detected with EEG (see Klimesch, 1999, p. 174 for a discussion of the tau rhythm).
Conducting current sources and spatial resolution
Current sources conduct in different directions in a volumous structure like the brain, i.e. radially and tangentially. Conduction along a given plane is also affected by the conductivities of the tissues and the depth of the current source (Wolters and Munck, 2007). So even though a current source is well-defined in space within the cerebral cortex, by the time it conducts up to the head through different layers of tissue, that all have different conductive properties, the current source will have “spread out”—in scientific terms, the spatial-scale of the LFPs are altered through the physical process of volume-conduction (Nunez and Srinivasan, 2005; Wolters and Munck, 2007). Due to volume condition a single electrode may measure a cortical electrical source within a ±6cm diameter from the centre of an electrode, and a single focal current source may be measured by 2 or more recording electrodes simultaneously (Nunez, Srinivasan, Westdorp, Wijesinghe, et al., 1997). Therefore, one gets essentially a “blurred image” of the cortical electrical activity with EEG, this is why EEG is said to have poor spatial resolution. However, as we can sample at high-rates: hundreds of times per second, EEG offers high-temporal resolution, allowing us to detect sub-second changes within the electrical fields of the cerebral cortex within a broad-frequency band: approximately DC-55Hz for human scalp EEG, depending on the recording environment and equipment used.

EEG amplitude and power
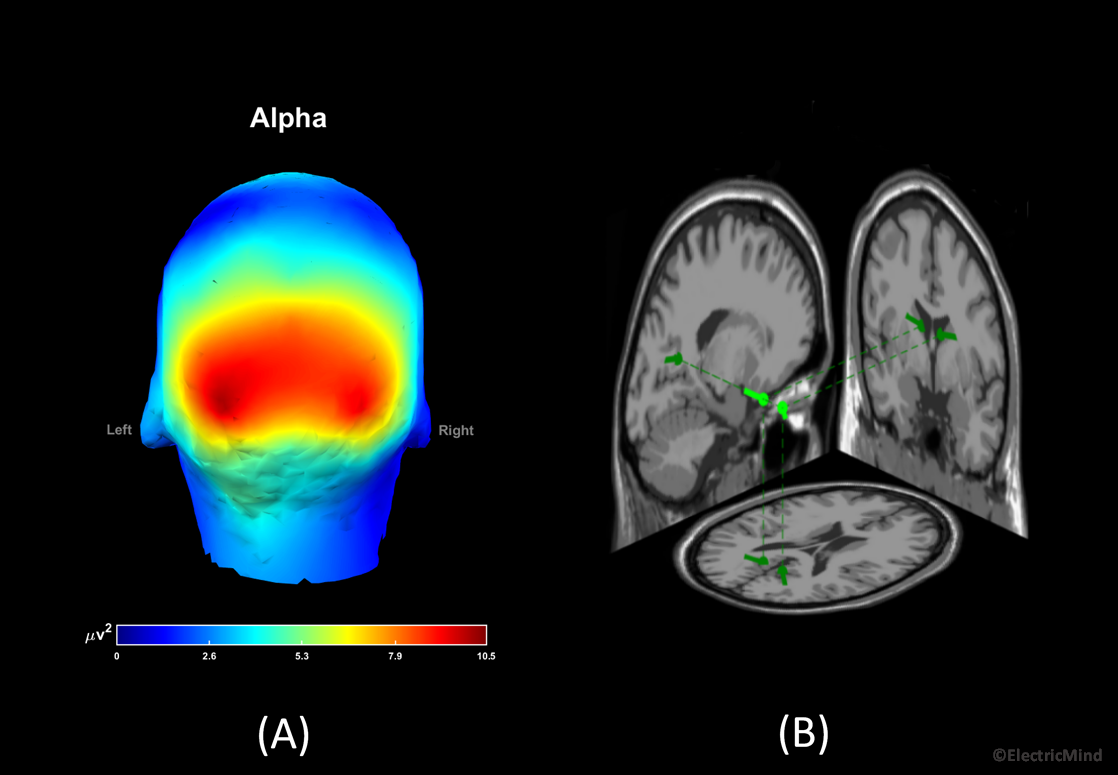
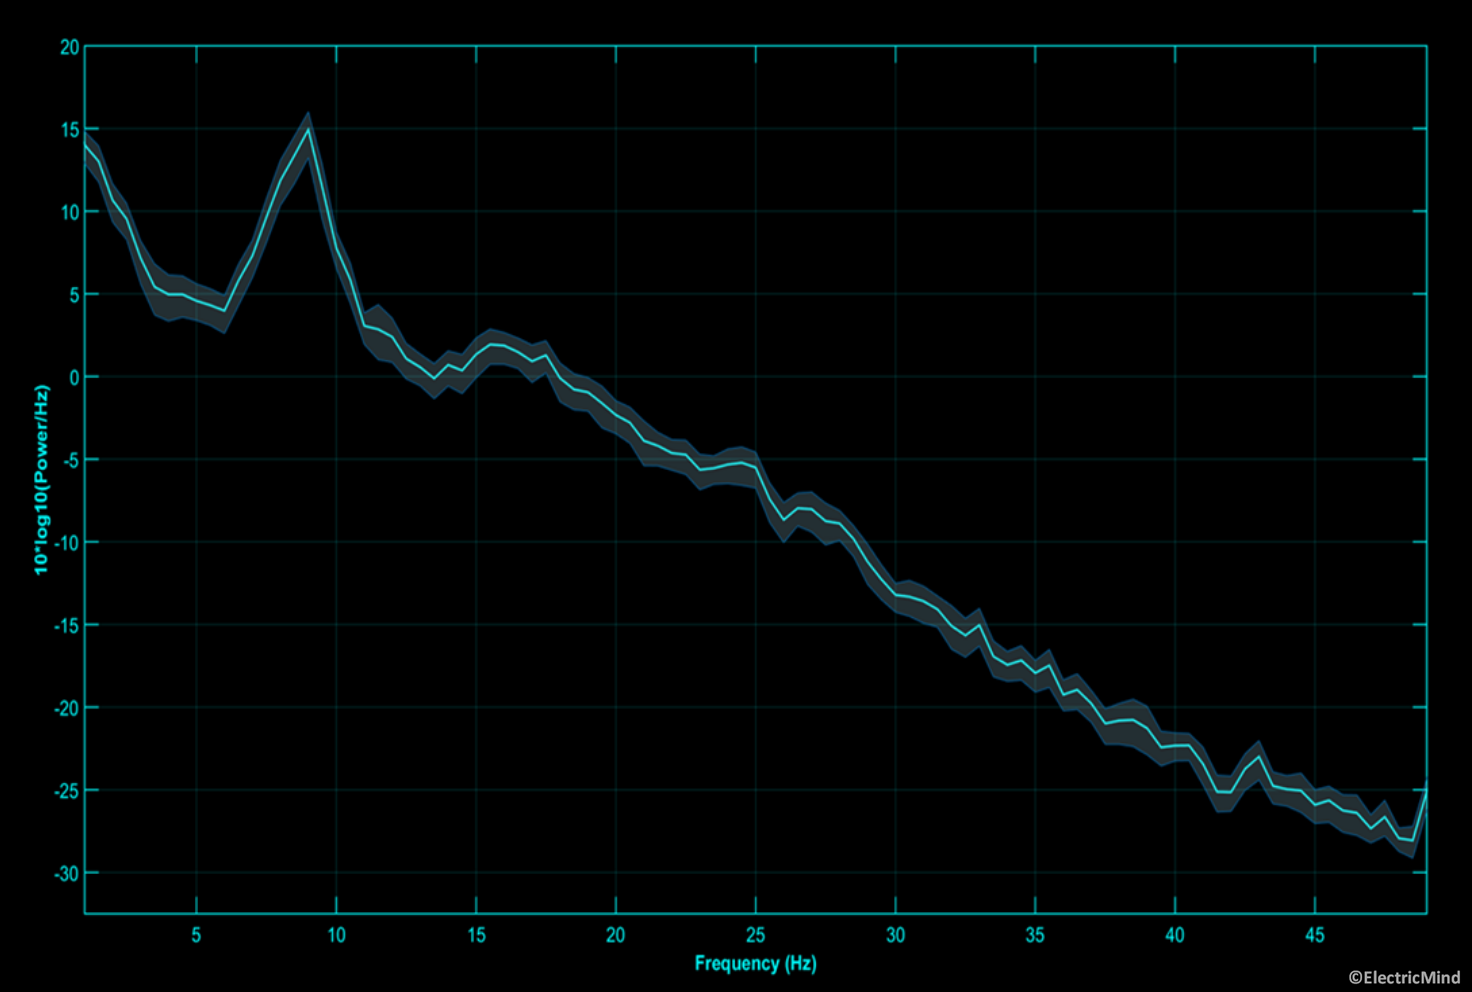
In terms of a correspondence in the EEG, the amplitude (and power) of the electrical activity measured on the scalp is related to the number of cortical neurons recruited into the synchronised neural activity: an increase in the population of synchronised neurons results in an increase in band-power; alternatively, a decrease in band-power corresponds to fewer neurons synchronised into a firing pattern (Lopes da Silva, 2013; Pfurtscheller and Lopez da Sliva, 1999). Certain amplitude changes at given frequencies over certain regions of the scalp tell us about the functional state of the participant or their state of health (Freeman, Milkulka, Prinzel and Scerbo, 1999; Gerhold, 2017; Klimesch, 1999; Onton, Delorme and Makieg, 2005; Pfurtscheller and Neuper, 1994). A good example, is an alpha band synchronisation, approximately 8Hz-12Hz in humans, over the back of the head when a participant closes his/her eyes—this observation dates back to the first paper on human EEG published in the 1920’s by Hans Berger (Berger, 1929). A full explanation of EEG-power analysis is given in our spectral analysis posts: Part 1 – Analysing the Spectral Content of an EEG Signal and Part 2 – Analysing the Spectral Content of an EEG Signal.
The propitious nature of EEG
Where EEG holds a position of advantage is that it is incredibly effective at detecting changes in electrocortical fields and their psychological correspondences occurring at millisecond timescales, it is this aspect of EEG that is of great interest to military and aerospace applications as well as businesses innovating in the neurotechnology space: in the development of brain-computer interfaces to assist paralysed and disabled people, real-time monitoring and analysis of psychological function in aviation and the workplace, as well as other ergonomic and business-related applications (see Vecchiato, Cherubino, Trettel and Babiloni, 2013 for a comprehensive scientific-methodological text dealing with advertising-related applications).
Looking forward
This article provided a grounding for the neurophysiological processes underpinning EEG. In the next part of this series, we will look at the steps in performing an analysis of EEG data. We will demonstrate some of the original observations made in the human EEG by Hans Berger in the 1920’s and also look at some of the more contemporary approaches to EEG analyses.
Amzica, F. & Lopes da Silva (2017). Cellular substrates of brain rhythms. In Schomer, D. L., & Lopes da Silva, F. L. (Eds) Niedermeyer’s electroencephalography: basic principles, clinical applications, and related fields (7th ed). Oxford University Press.
Delorme, A., & Makeig, S. (2004). EEGLAB: an open source toolbox for analysis of single-trial EEG dynamics including independent component analysis. Journal of Neuroscience Methods, 134, 9–21.
Berger, H. (1929). Uber das Elektroenkephalogramm des Menschen. Archiv für Psychiatrie und Nervenkrankheiten, 87, 527–570.
Freeman, F. G., Milkulka, P. J., Prinzel, L. J. and SCerbro, M. W. (1999). Evaluation of an adaptive automation system using three EEG indices with a visual tracking task. Biological Psychology, 50, 61 76.
Gerhold, M. M. (2017). A study of event-related electrocortical oscillatory dynamics associated with cued motor-response inhibition during performance of the Go/NoGo task within a sample of prenatally alcohol-exposed children and age-matched controls. Doctoral Thesis. University of Cape Town: Cape Town.
Klimesch, W. (1999). EEG alpha and theta oscillations reflect cognitive and memory performance: a review and analysis. Brain Research Reviews, 29, 169–195.
Lopes da Silva, F. (2013). EEG and MEG: Relevance to Neuroscience. Neuron, 80, 1112-1128.
Nunez, P. L., & Srinivasan, R. (2005). Electric fields of the brain: the neurophysics of EEG. New York: Oxford University Press.
Nunez, P. L., Srinivasan, R., Westdorp, A. F., Wijesinghe, R. S., Tucker, D. M., Silberstein, R. B., & Cadusch, P. J. (1997). EEG coherency I: statistics, reference electrode, volume conduction, Laplacians, cortical imaging, and interpretation at multiple scales. Electroencephalography and Clinical Neurophysiology, 103, 449-515.
Onton, J., Delorme, A., & Makeig, S. (2005). Frontal midline EEG dynamics during working memory. NeuroImage, 27, 341–356.
Pfurtscheller, G., & Lopes da Silva, F. L. (1999). Event-related EEG/MEG synchronization and desynchronization: basic principles. Clinical Neurophysiology, 110, 1842–1857.
Pfurtscheller, G., & Neuper, C. (1994). Event-related synchronization of mu rhythm in the EEG over the cortical hand area in man. Neuroscience Letters, 174, 93–96.
Pfurtscheller, G., Stancák, A., & Neuper, C. (1996). Post-movement beta synchronization. A correlate of an idling motor area? Electroencephalography and Clinical Neurophysiology, 98, 281–293.
Suffczynski, P., Kalitzin, S., Pfurtscheller, G., & Lopes da Silva, F. H. (2001). Computational model of thalamocortical networks: dynamical control of alpha rhythms in relation to focal attention. International Journal of Psychophysiology, 43, 25–40.
Wendling, F. & Lopes da Silva, F. H. (2017). Dynamics of EEGs as signals of neuronal Populations: models and theoretical considerations. In Schomer, D. L., & Lopes da Silva, F. L. (Eds) Niedermeyer’s electroencephalography: basic principles, clinical applications, and related fields (7th ed). Oxford University Press.
Wolters, C. and de Munck, J. C. (2007). Volume conduction. Scholarpedia, 2, 1738.
Vecchiato, G., Cherubino, P., Trettel. A., and Bablioni, F. (2013). Neuroelectrical brain imaging tools for the study of the efficacy of TV advertising stimuli and their application to neuromarketing. Springer-Verlag: Berling.

Published under: EEG


